GLM-4.7-Flash Crawled on My Mini PC. Here's Why, and How I Fixed It.

I run most of my local models on the same little box I keep writing about: a UM790Pro with a Ryzen 9 7940HS, the Radeon 780M iGPU, and 96 GB of DDR5. It is not a workstation. It sips power and sits on a shelf, and for the models I actually care about, sparse mixture-of-experts with a few billion active params, it has been surprisingly capable. My daily 30B-class A3B model runs around 18 tokens a second on it.
So when GLM-4.7-Flash showed up (30B total, 3B active, strong coding scores) I expected the same ballpark. I got a third of it. Here is what went wrong, why, and the one change that made it usable.
The numbers that did not add up
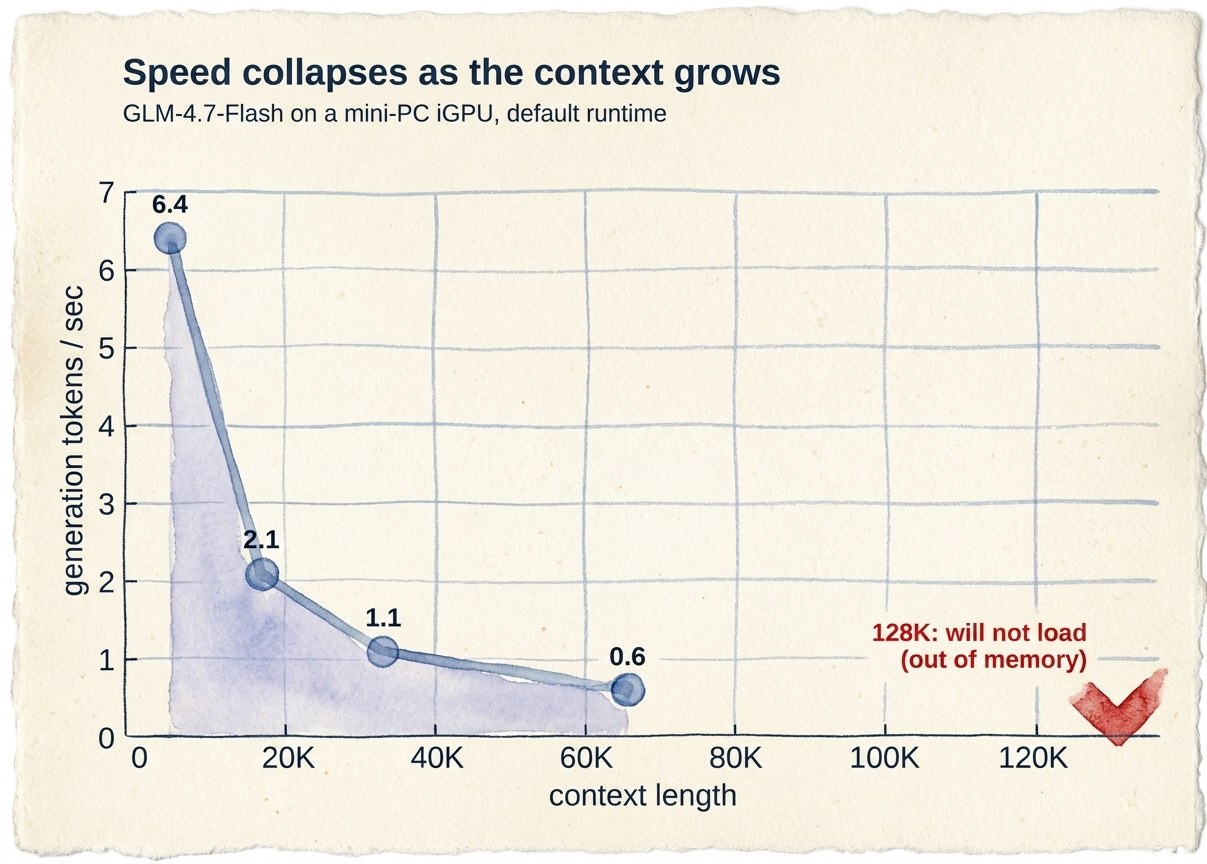
I pulled a Q4 build and ran it through Ollama on the Vulkan backend. Generation speed by context length:
| context | generation |
|---|---|
| 4K | 7.3 tok/s |
| 16K | 2.1 tok/s |
| 32K | 1.1 tok/s |
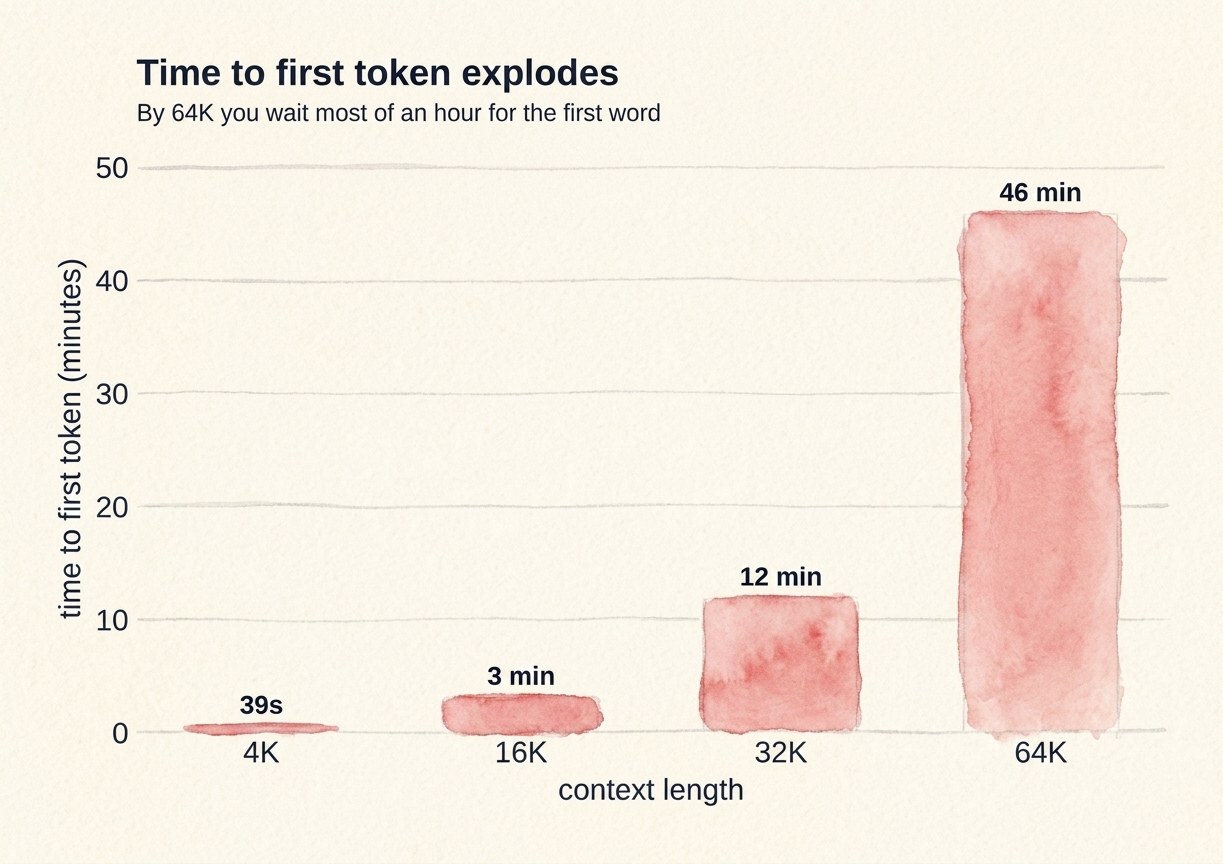
| 64K | 0.6 tok/s (46 minutes to first token) |
| 128K | does not run (out of memory) |
Two things jump out. First, 7 tokens a second at short context is already slow for a 3B-active model on this box. Second, and worse, it falls off a cliff. Every time the context doubles, the speed roughly halves.
The time to first token tells the same story from the other side. By 64K you are waiting most of an hour just to get the first word back.
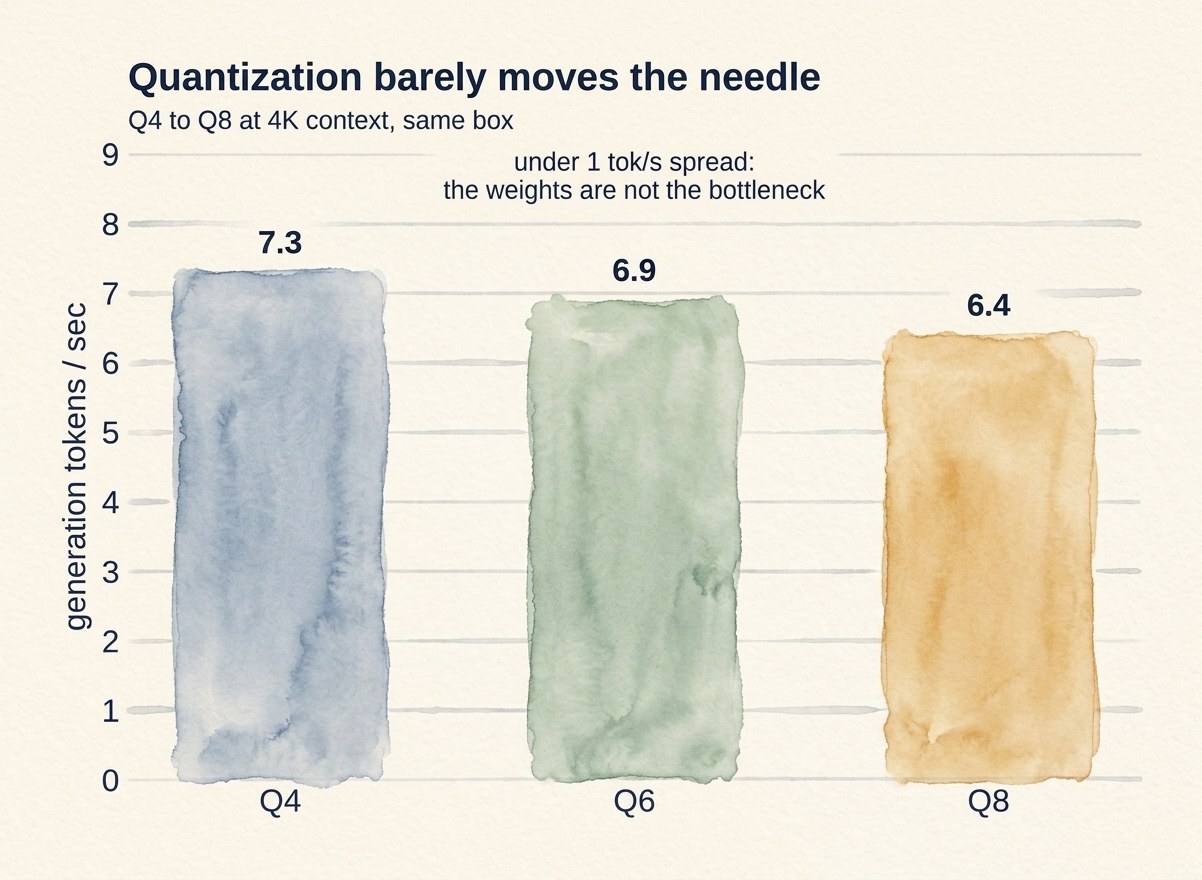
I assumed quantization was the lever, so I tested Q4, Q6, and Q8. They landed within a token a second of each other at short context, and identical at 32K. That was the first real clue. If shrinking the weights from 31 GB down to 18 GB barely changes the speed, the weights are not the bottleneck. Something in the attention path is.
The actual cause: a fancy attention mechanism with no fast path
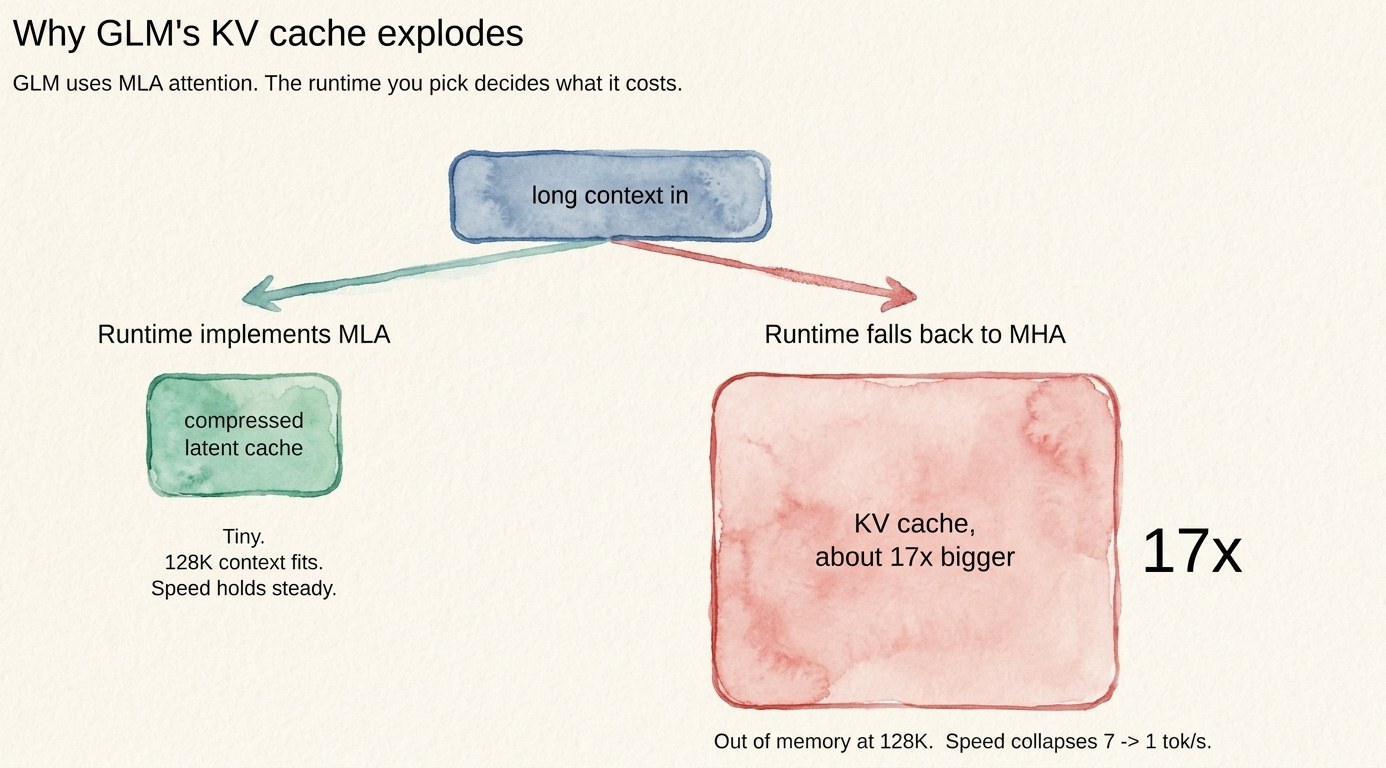
GLM-4.7-Flash uses Multi-head Latent Attention (MLA), the same trick the DeepSeek models use. MLA is clever. It compresses the key/value cache into a small latent, so in theory the memory footprint at long context stays tiny. The catch is that it needs a runtime that actually implements MLA. If the runtime does not recognize it, the model falls back to plain multi-head attention, and the KV cache balloons to roughly seventeen times its intended size. That is the cliff. The cache grows so fast with context that you run out of memory and the per-token work explodes.
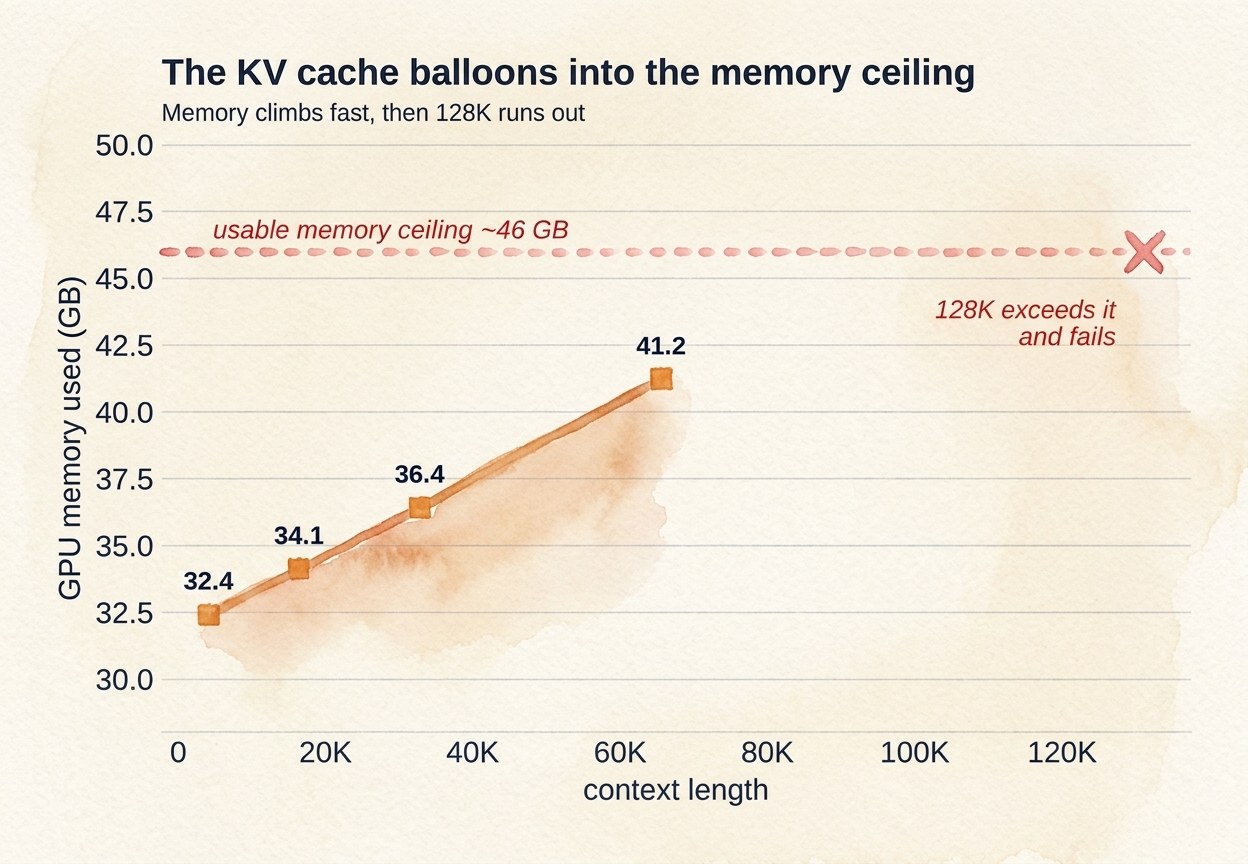
There is a second problem stacked on top. On AMD integrated graphics, the Vulkan backend has no flash-attention kernel. Flash attention exists on some NVIDIA drivers and basically nowhere else, so on this 780M the attention work either runs unfused or quietly spills to the CPU. For a model where attention is the expensive part, that is brutal.
Put it together: an oversized cache from the MHA fallback, plus no accelerated attention, on a small iGPU that shares one 80 GB/s memory bus with the CPU. The model was fighting the entire stack.
One thing I want to flag, because I wasted time chasing it: this had nothing to do with the model being a community “uncensored” build. Removing refusals is a weight edit. It changes behavior, not speed. A stock build is exactly this slow.
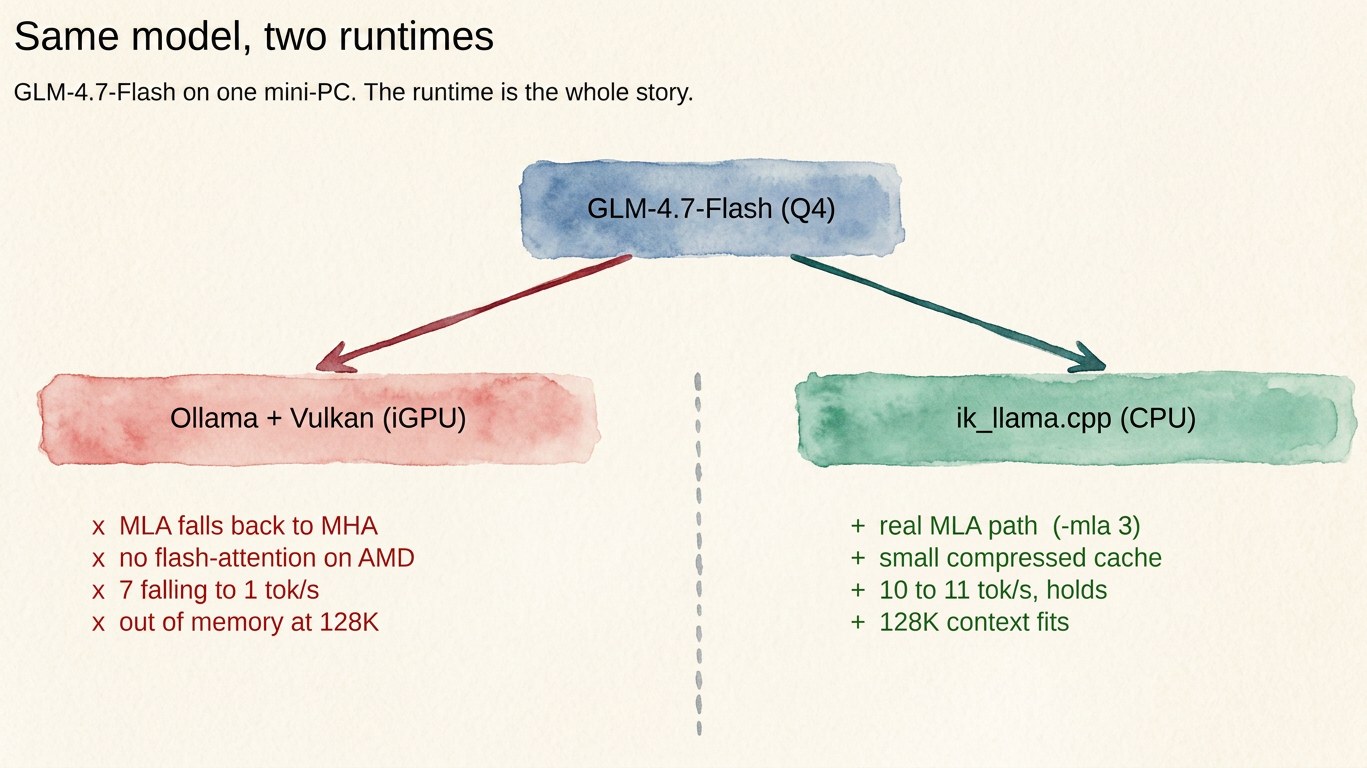
The fix: run it on a runtime that does MLA properly
The memory blowup is a software problem, so the answer is software. ik_llama.cpp is a fork of llama.cpp built around exactly this case: MLA models, with an explicit small-cache attention mode. I built it CPU-only (the iGPU is not helping here anyway, and on a unified-memory box the CPU reads the same RAM at the same speed), pointed it at the Q4 build I already had, and turned on its MLA path.
It loaded the model correctly, as a DeepSeek-class architecture, which is what it is under the hood. And the cliff was gone:
| Ollama / Vulkan | ik_llama.cpp / CPU, MLA on | |
|---|---|---|
| short-context generation | 7.3 tok/s | 10 to 11 tok/s |
| behavior with context | collapses to ~1 tok/s | holds |
| 128K context | out of memory | fits (small cache) |
So a rough 40 percent bump at short context, and far more importantly, the speed stops falling apart as the context fills. A tuned community build of the same model nudged it to 11.4 tok/s. I did not even need to re-download anything. The build I already had works fine once the runtime stops mishandling the attention.
What I would tell someone hitting this
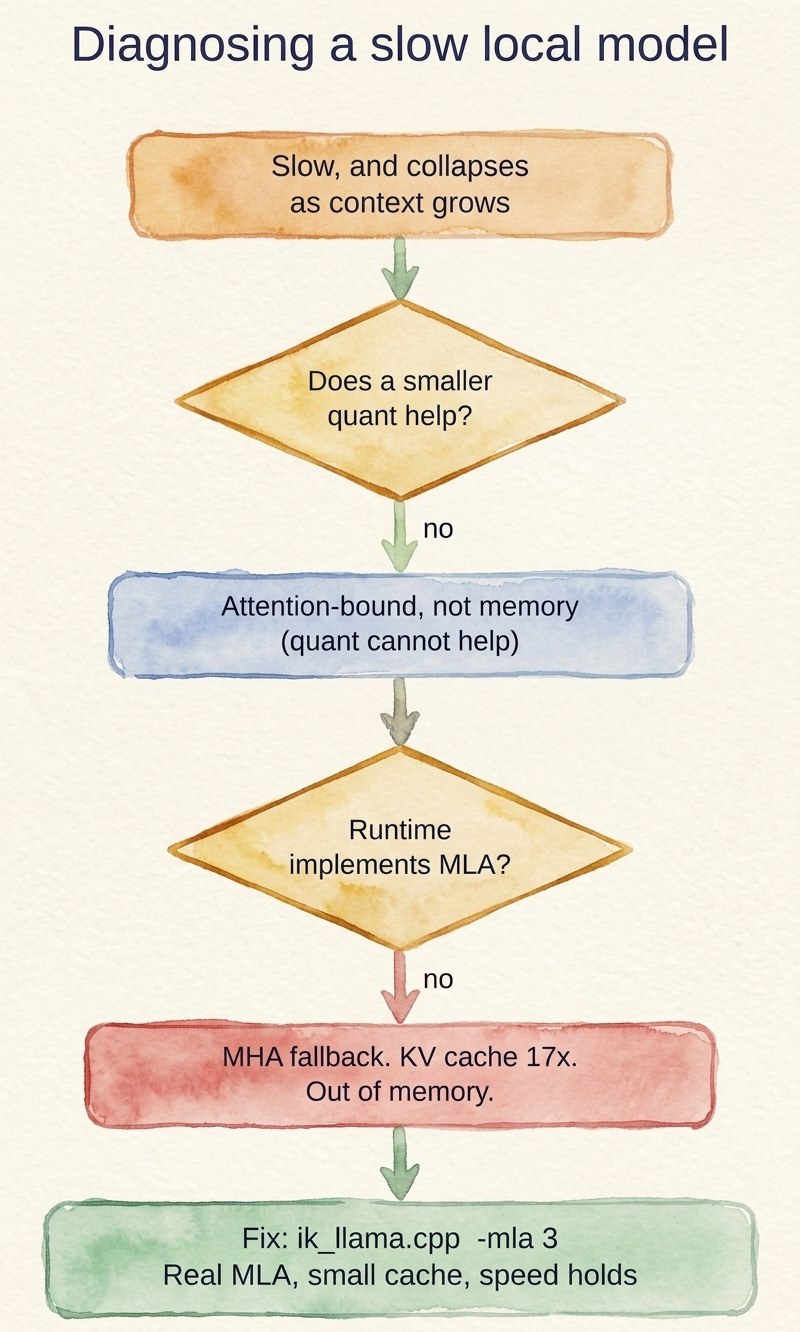
- If a new model is mysteriously slow and collapses with context, check whether it uses MLA. The huge KV cache is the tell.
- Quantization will not save you here. If Q4 and Q8 run at the same speed, you are attention-bound, not memory-bound, and a smaller quant just frees up disk.
- On AMD integrated graphics, do not assume flash attention helps. It is a CPU-fallback trap. Test with it off.
- For an MLA model on this class of hardware, a CPU runtime with a real MLA mode beat the iGPU. That felt wrong until I remembered the iGPU and the CPU read the same memory at the same speed, and only the CPU runtime had the fast attention path.
The honest catch, which I will get into in a follow-up: even fixed, this model stays slower than a plain GQA model of the same size on this box, because MLA is just heavier to run here. So the real question is not “can I make it work,” because you can. It is “is it worth running instead of the thing that is already fast.” That is a benchmark for the next post.